This guide will clarify what eNPS is, how it’s scored, and demonstrate how to utilize the eNPS survey type within Prosper EX.
1. What is eNPS?
eNPS stands for “Employee Net Promoter Score.” It’s a metric used to measure employee satisfaction and loyalty within an organization. It’s derived from the Net Promoter Score (NPS) framework, which is commonly used to gauge customer satisfaction and loyalty.
2. How is eNPS scored and calculated?
To calculate eNPS, employees are asked a single question: “On a scale of 0-10, how likely are you to recommend [Company Name] as a place to work?” Based on their responses, employees are categorized into three groups:
- Promoters (score 9-10): These are employees who are highly satisfied and likely to promote the company as a good place to work.
- Passives (score 7-8): These are satisfied but not enthusiastic employees. They’re less likely to actively promote the company.
- Detractors (score 0-6): These are dissatisfied employees who may actively speak negatively about the company.
The eNPS is then calculated by subtracting the percentage of detractors from the percentage of promoters. The resulting score can range from -100 to +100. A positive score indicates that there are more promoters than detractors, suggesting a generally satisfied and loyal workforce. Conversely, a negative score indicates that there are more detractors than promoters, highlighting potential issues with employee satisfaction and loyalty.
3. What is a good score?
Grading eNPS scores in a spotlight format can provide a quick and intuitive way to interpret the results. Here’s a common grading scale based on eNPS scores:
Excellent (Green):
- Score Range: +20 to +100
- Description: An excellent score indicating a highly satisfied and loyal workforce. This suggests that a significant majority of employees are promoters and are likely to recommend the company as a great place to work.
Acceptable (Amber):
- Score Range: +1 to +19
- Description: A good score indicating overall satisfaction and loyalty among employees. While there may be areas for improvement, the majority of employees are promoters, contributing positively to the company’s reputation as an employer.
Needs Improvement (Red):
- Score Range: -100 to 0
- Description: A score suggesting that there are as many detractors as promoters or that there’s a significant proportion of detractors within the organization. This indicates areas where the company needs to focus on improving employee satisfaction and loyalty.
4. eNPS User Guide
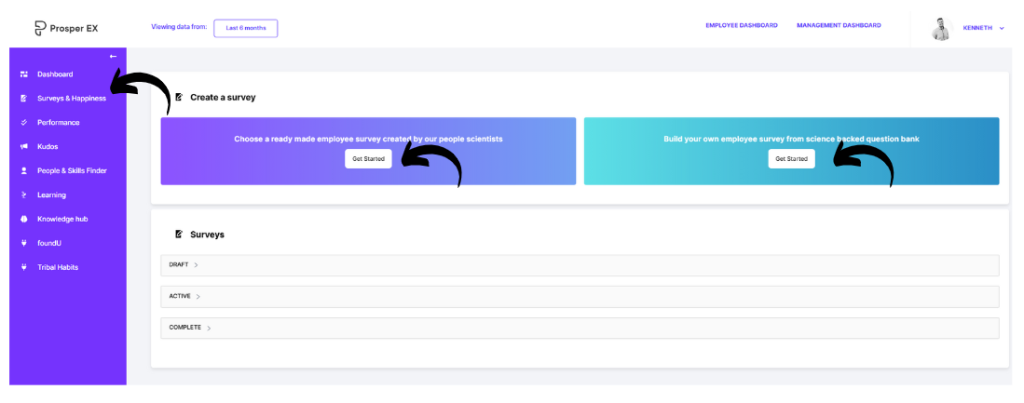
To locate the pre-made eNPS survey click ‘Surveys & Happiness’ menu item and click ‘Ready made surveys’. Or to build your own survey using the eNPS question type, click the ‘Surveys & Happiness’ menu item and click ‘Build your own’.


For more information on building your own survey and using ready-made templates see the below links.
User Guide: How to Use and Customize Surveys, reorder, preview and more – Prosper EX
User Guide: How to Build Your Own Surveys in Question Bank – Prosper EX
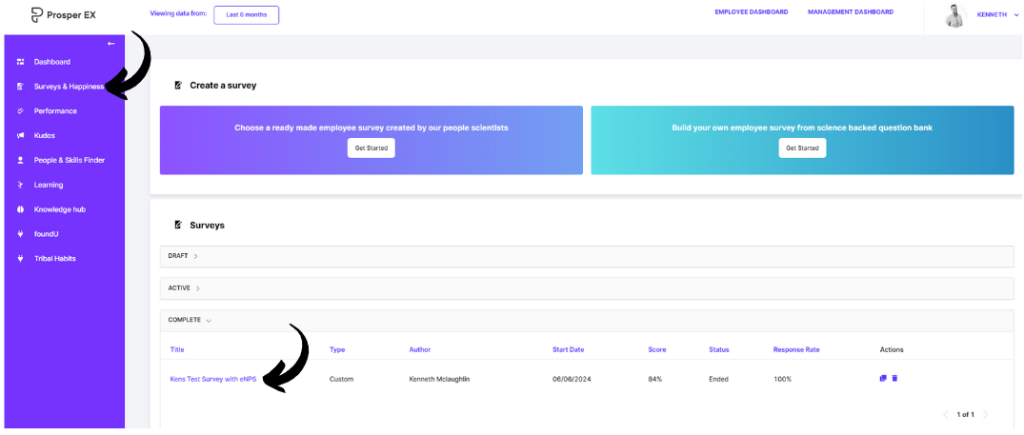
To view live or completed survey eNPS scores, click the ‘Survey & Happiness’ menu item and locate the survey you wish to view and click the title.
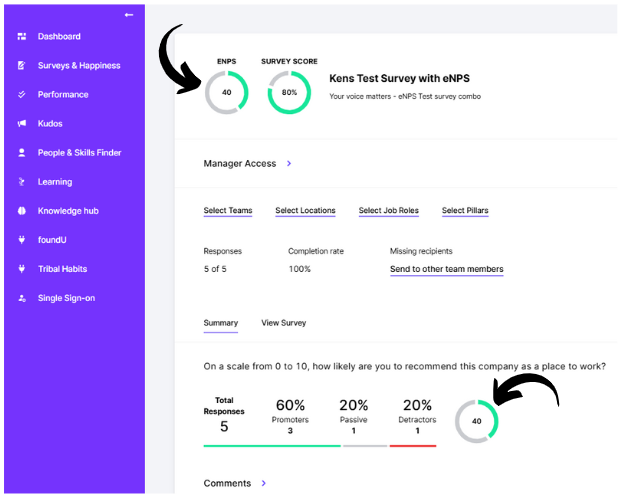
Your live or completed survey eNPS score is reported both with the eNPS question, and at the top of the survey. If you are running other survey questions with the eNPS, both scores are reported here.
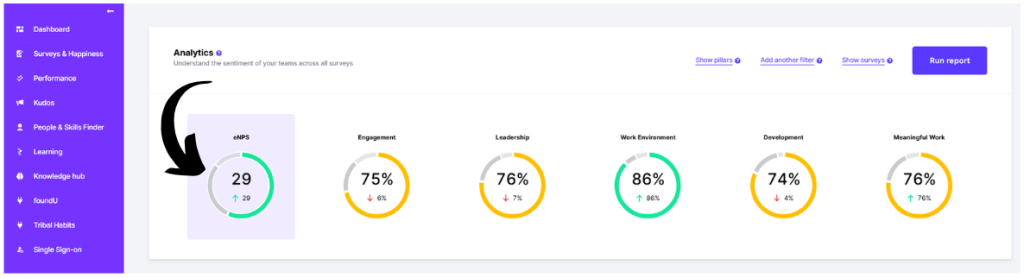
When navigated to your Managers Dashboard the eNPS score will be visible in the Analytics widgit. The data shown here is reflective of the viewing data range you have selected at the top of the page.